How I Turned My Laptop Into A Micro Data Center
It's Corona season and I'm sitting in my house all alone looking at
my spare computer and thinking... What can i do with 8GB of RAM? A Data
center i said!
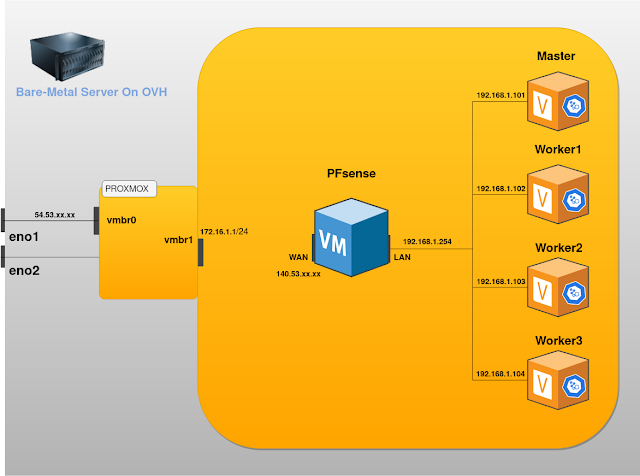
I started digging and linking components together in my head. I came up with this:

In this tutorial i will demonstrate how you can turn your personal computer into a production grade environment for live k-native development.
- Introduction
- Installing the underlying OS.
- Reducing OS footprint.
- Installing k3s.
- Post installation hacks [ Private DNS Resolution,..].
- Installing Prometheus & Grafana
- Installing Polaris
- Live development with skaffold
- Beyond μDC, Embracing gitOps [Insight].
1. Introduction
If you haven't the article i linked above then k-native is way of developing applications in a fast pace leveraging Kubernetes. To learn move follow this link.According To Redhat We need Three components to achieve our goal:
Building - A flexible approach to building source code into containers.
Serving - Enables rapid deployment and automatic scaling of containers through a request-driven model for serving workloads based on demand.
Eventing - An infrastructure for consuming and producing events to stimulate applications.
So here's what you'll get in the end. You will be writing your code, and watching the changes live on the remote Kubernetes cluster.
I want to learn the secure and hard way, deploy robust applications and understand what powers up my application, i bet you do too.
We'll have three tools responsible for monitoring and alerting. That way we can master the way we handle our cluster and our code.
For the cluster we'll use k3s. A kubernetes distribution that is built for Iot devices and stuff like Edge kubernetes. Knowing that it was Developed by RancherLabs and certificed by CNCF, made me rest at ease and i stopped benchmarking.
2. Installing the underlying OS
I used Debian for the operating system. you can grab the latest minimal server iso here.The choice of Debian, a Linux distribution was mainly for stability and low resource consumption. I needed the minimal stuff in there to run a kubernetes cluster. K3OS was an option, but i need to experiment with it first.
During the installation, when you're asked to choose tools, leave the default stuff, and add ssh server.
3. Reducing OS footprint.
You can go further and remove the graphical interface. But really, it's awesome and lightweight as it is. Don't go hardcore.4. Installing k3s
The dudes in rancher Labs went and deleted 3 million lines of code from kubernetes. Replaced etcd with sqliteThey say: A Lightweight Kubernetes. Easy to install, half the memory, all in a binary less than 50mb. Holly shit! it's true.
It is really simple to install this tool since it is written in go. In one command:
$ curl -sfL https://get.k3s.io | sh -
5. Post installation hacks
Let's first talk k3s vs k8s. There are a few changes that we should be aware of. For example the default location for the cluster configuration changed. the default traffic manger is traefik not nginx.
Let's write some commands:
Change ownership of k3s config file:
$ sudo chown $USER:$USER /etc/rancher/k3s/k3s.yamlExport kubernetes environment variable for helm:
$ export KUBECONFIG=/etc/rancher/k3s/k3s.yamlInstall helm-v3:
$ curl https://raw.githubusercontent.com/helm/helm/master/scripts/get-helm-3 | bashAdding google's stable repository. Everything in this repository is tested and production grade:
$ helm repo add stable https://kubernetes-charts.storage.googleapis.com$ helm repo update
We're all set.
6. Installing Prometheus & Grafana
Prometheus is now the de-facto for kubernetes monitoring. Combined with Grafana, you get all the metrics you need to debug everything.CNCF certified, say no more! In my book, that's production grade.
Prometheus is really powerful. It can handle extreme loads, one reason for that is the fact that Prometheus collects metrics from the application not the other way around. This gives it the possibility to back off and adjust itself depending on the allocated compute power and the state of the ecosystem.
Combined with a cooooool dashboard called Grafana. We'll use this for a better development workflow. A little hack to have a local DNS resolution and we have a website! look at grafana.kyoumatrix.io it doesn't exist outside of my server.
I'm connecting to this url through my other computer. I added some urls in /etc/hosts on both laptops and i can reach the ingress. Bingo!

Let's create a namespace for our monitoring applications and install both prometheus and grafana:
Download my project here and position yourself inside the micro-data-center folder.
$ kubectl create ns monitoring
$ helm install monitoring -f prometheus-values.yaml stable/prometheus-operator -n monitoring
7. Installing Polaris
Now i love following best practices and code conventions. I strive to make state of the art products. Therefore having a tool that can monitor the best practices in my Kubernetes cluster is a must.I chose Polaris, It runs a variety of checks to ensure that Kubernetes pods and controllers are configured using best practices, helping me avoid problems in the future.
$ kubectl apply -f https://github.com/FairwindsOps/polaris/releases/latest/download/dashboard.yaml
We'll add our own ingress from here.
$ kubectl apply -f ingress-polaris.yaml
Add the domain name to /etc/hosts And you'll have something like this:

looks like i have some work to do :p
Notice the url polaris.kyoumatrix.io i added it in /etc/hosts on both computers pointing to my ip@. You can find your ip by typing ip a and searching for an entry with enp0**
8. Installing Skaffold
Now comes the cool stuff, Skuffold. Those google engineers are like gods!They explain it the best: Skaffold is a command line tool that facilitates continuous development for Kubernetes applications.You can iterate on your application source code locally then deploy to local or remote Kubernetes clusters. Skaffold handles the workflow for building, pushing and deploying your application. It also provides building blocks and describe customizations for a CI/CD pipeline.
Let's look at this screenshot from my terminal

What happened is skaffold built my project, created a docker image and pushed it to docker hub. then created a pod in my cluster and started watching for live changes to update the running container.
Holly Magic!
Wait for the best part. It is only consuming 2.597 GB of RAM at rest. You are left with 5.403 GB to play with.

Create a repository in hub.docker.com and change the image in skaffold.yaml
$ git clone https://github.com/Kyouuma/Tutorials.git
$ cd Tutorials/micro-data-center
$ skaffold dev
Enjoy.
9. Beyond μDC, Embracing gitOps
What enabled such a rapid workflow? The need to deliver fast. A very competitive environment, companies coming together to collaborate on big projects.gitOps i would say is the point in time where DevOps started maturing.
Cloudbees says, GitOps is a paradigm or a set of practices that empowers developers to perform tasks which typically fall under the purview of IT operations.
Meaning git will be the source of truth for everything. Even infrastructure as we embrace Iac, Infrastructure as Code. A way of levering the abstractions regarding virtualized environments.
I hope you find this article useful.

Comments
Post a Comment